Flows! Plus, MFO Mid-Year Review 2024

All fund risk and return metrics, ratings, and analytics were uploaded to MFO Premium, Saturday, 29 June, reflecting performance through mid-year. Our latest fund flow data were uploaded yesterday, Monday, 8 July. Refinitiv drops the flow data on the 1st and 3rd Saturday of each month.


We’ve scheduled our mid-year review webinar this Wednesday (tomorrow), 10 July at 11 am Pacific (2pm Eastern). It will highlight performance of funds across different market segments and showcase various search features since our year-end webinar, which include:


  • MFO Flows, short for fund asset flows, is a significant upgrade this year (click example below for Fidelity’s Total Bond Fund ETF),
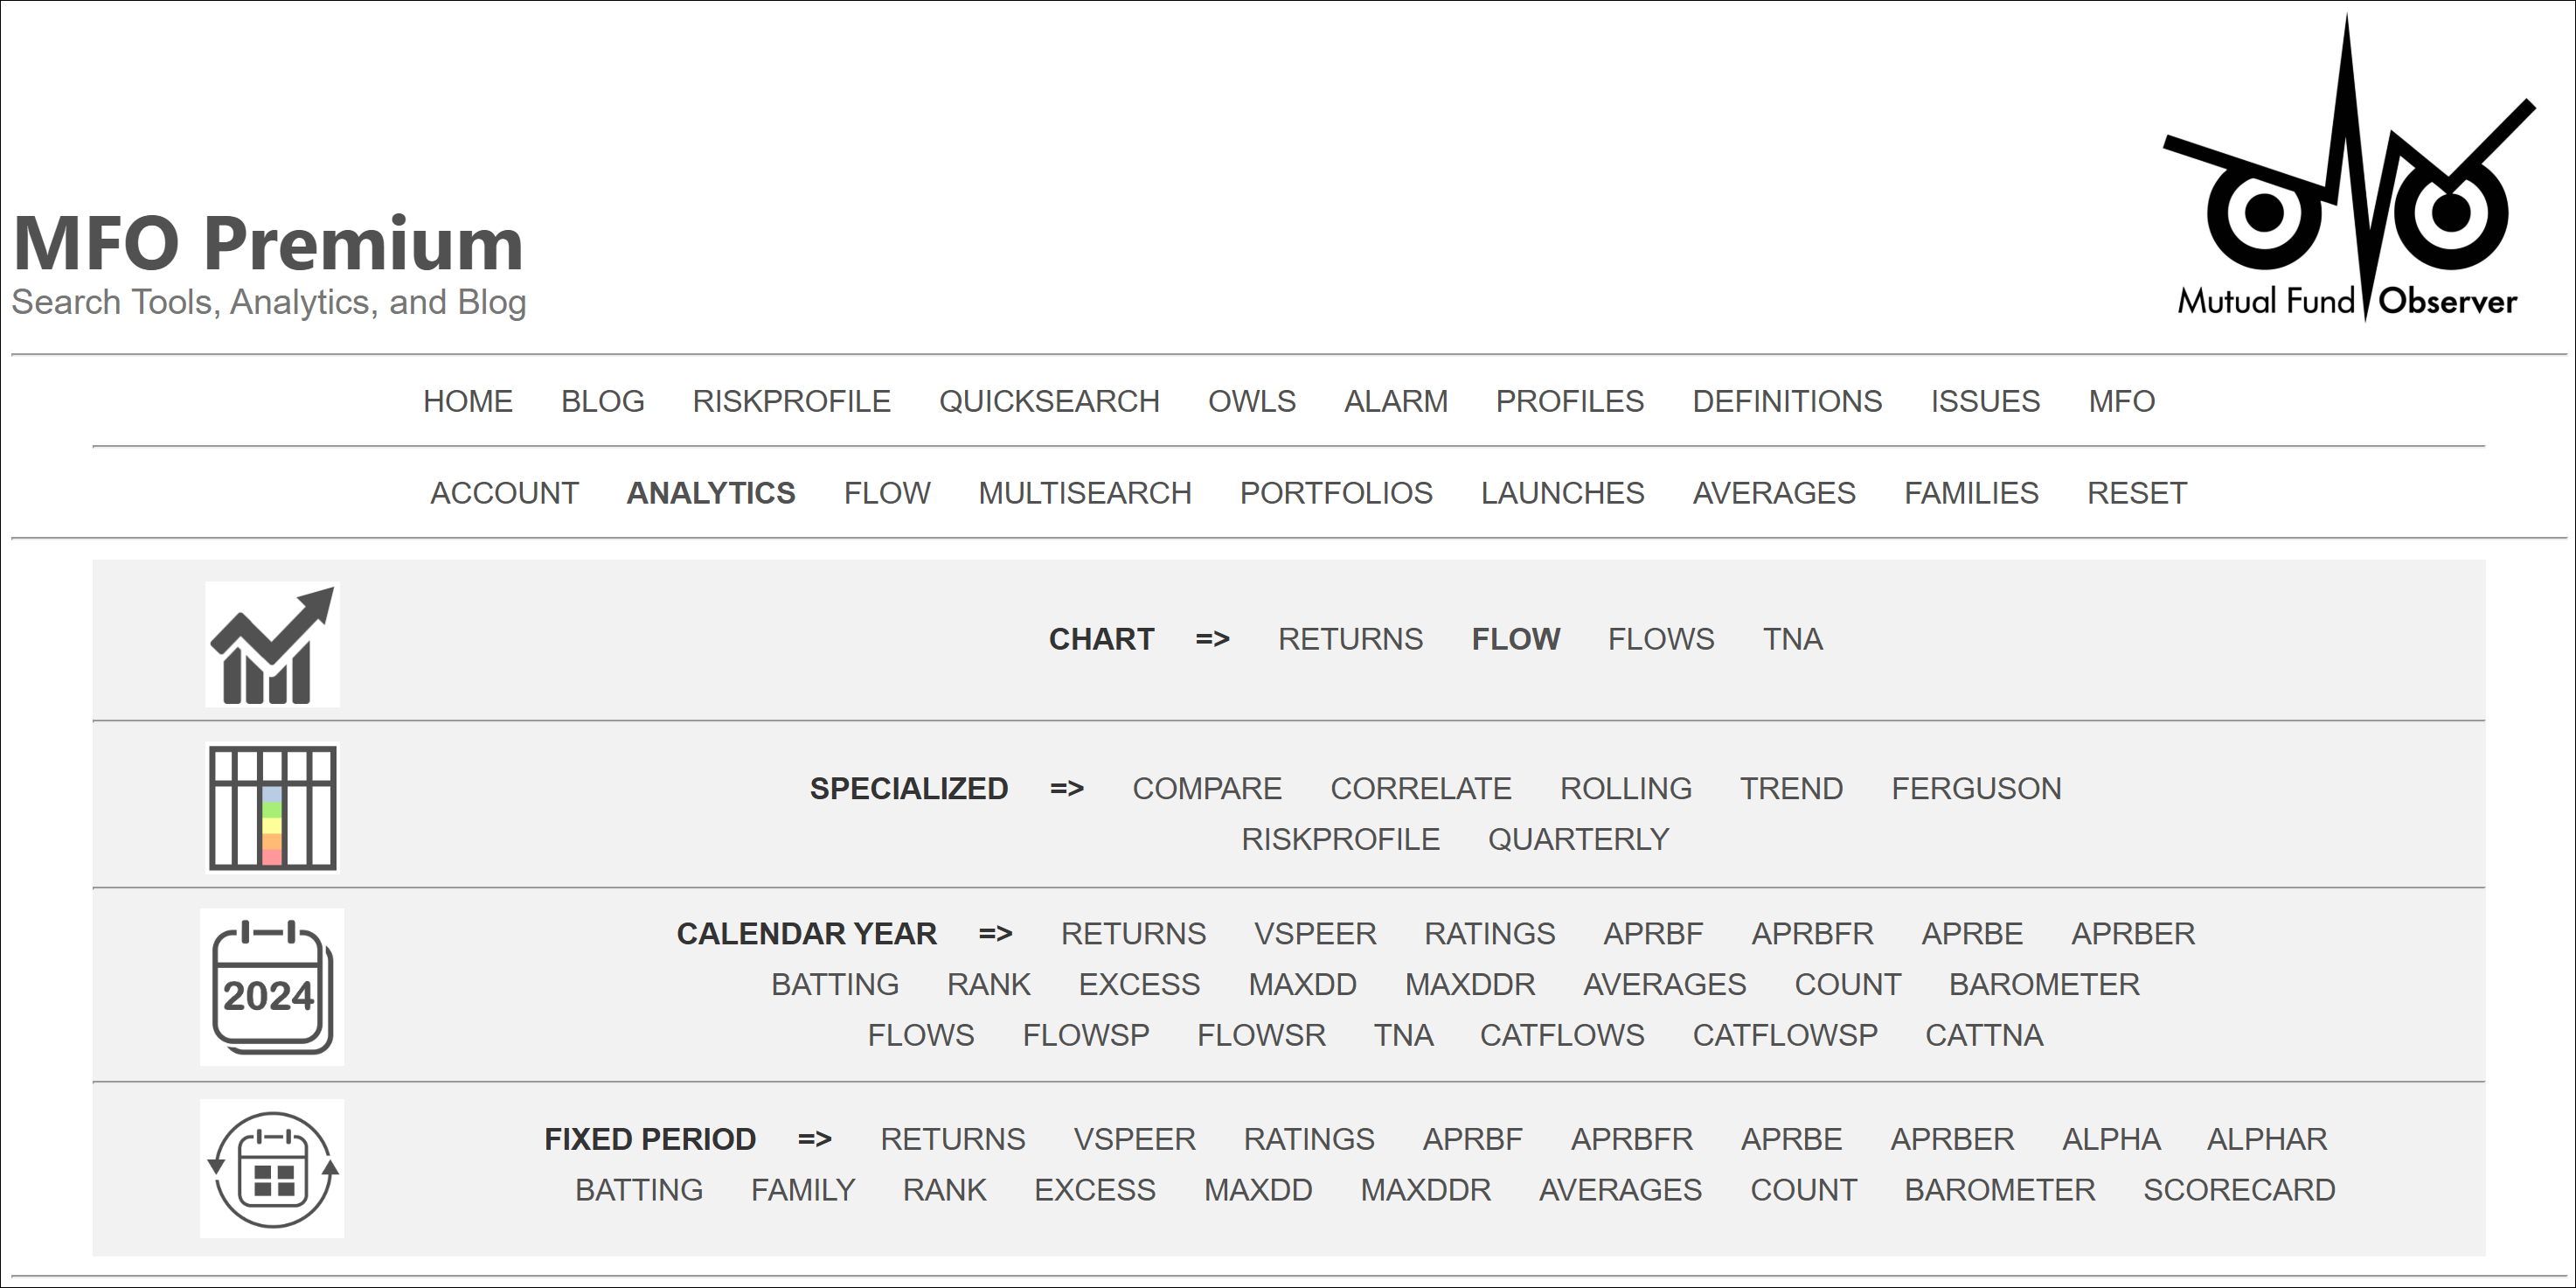
  • A new Analytics user interface, which allows users to jump quickly across various tools, like Return Chart, Flows, Correlation, Ferguson, Momentum, and Calendar Year Drawdown,
  • ETF Benchmarks, championed by our MFO colleague Devesh Shah.


Join us if you can by registering here.


US equity markets remain at or near all-time highs. June marks the 30th full month of The Great Normalization market cycle and the 21st month of this market’s bull run.


Berkshire Hathaway, which our colleague Lynn Bolin wrote about this month, convenience ticker BRKA, has generated 13.1% annualized over this cycle, more than QQQ and SPY, at 8.5 and 7.2, respectively. But across the 21-mo bull, QQQ beats almost all at 40.6% annualized. Generally, it’s been a cycle favoring large caps, especially large growth.


Will save more for the webinar.


My report from the recent Morningstar conference can be found here: Morningstar Celebrates 40th Year – MICUS Chicago 2024.


As always, if you see anything amiss or have suggestions for improvement, let us know and we will respond soonest.


PS. Good session. Healthy turn-out today. Thank you!


Link to video.


Link to chart deck.

December Brings S&P 500 To All-Time High

All fund risk and return metrics, ratings, and analytics were uploaded to MFO Premium Saturday, 30 December, reflecting performance through year-end. We used Refinitiv’s Friday data drop, which was last business day of year, to get an early peek at 2023 calendar year performance.


We’ve scheduled our year-in-review webinar this Friday, 5 January. It will highlight performance of funds across different market segments and attempt to showcase various search features, including additions since our mid-year webinar. There will be just one session this year at 9 am Pacific (noon Eastern). Join us if you can in the New Year by registering here. And here is link to chart deck for session.


December is the second full year of The Great Normalization market cycle. It also marks the 15th month of this market’s bull run and brings the S&P 500 to an all-time high. The index ended the year up 26.3%. Since the start of the bull run in October 2022, it’s up 35.8%. Here’s a breakout of State Street Sector ETF 2023 performance, which is a Pre-Set Screen in MultiSearch:


Bonds seem to have turned around finally after a terrible 2022. AGG, iShares Core US Aggregate Bond ETF, rallied 8.2% in the last two months, bringing its yearly return to 5.6%.


If you have not already, be sure to check-out our new YouTube channel @MFOPremium, as described in the MFO December commentary.


Will save the rest for the webinar!


As always, if you see anything amiss or have suggestions for improvement, let us know and we will respond soonest.


Wishing you and yours all good things in the New Year!


PS. Links to session …


Link to video.


Link to chart deck.

Our World – Fund Demographics

The series of charts below summarizes latest fund demographics. Simple tally of funds by asset universe, shares class, type, subtype, fund category, and other (e.g., interval funds, ESG funds). Reflects current data on MFO Premium, which is derived from Refinitiv Lipper Global Data Feed (LGDF), dated Friday, 7 July 2023. Included a couple charts on assets under management (AUM), which will be somewhat elevated over actual since includes fund of funds … but, they appear to give reasonable sense of absolute and relative size.


Continue reading “Our World – Fund Demographics”

Best Performing Funds Since COVID

All fund risk and return metrics, ratings, and analytics were uploaded to MFO Premium on Sunday 2 July, reflecting performance through June.
 
Concurrent with the new cycle, described in this month’s MFO piece “Strong June Propels New Bull Market,” we introduced additional Display Period options in MultiSearch. The new periods include those covering The Great Normalization (TGN) cycle (full, bear, and bull … still on-going) and another named “Since COVID.” The latter reflects performance since January 2020, when the world turned upside down with the onset of coronavirus (COVID). Things have not been the same since.
 
Continue reading “Best Performing Funds Since COVID”

June Bloom: Welcome a New Bull Market

All fund risk and return metrics, ratings, and analytics were uploaded to MFO Premium yesterday, reflecting performance through May. The update uses Lipper’s Friday data drop, so return and drawdown performance is available through 2 June using our new Month To Date (MTD) display period.
 
Despite pervasive skepticism based on: Russian invasion. China US tension. Inflation. Rising rates. Bank collapses. Default fears. The S&P 500 has been climbing generally since October or 8 months ago. Month ending data has us 2% shy of a new bull market. But if you include MTD, the S&P is up more than 20%, which meets the definition. We’ll coin it The Great Normalization (TGN) Bull … the 7th bull market for S&P 500 since Vietnam War circa 1968.
 
Continue reading “June Bloom: Welcome a New Bull Market”

2022 Year-End Review Webinar

Thank you all for attending our year-end webinar! Here is link to video recording.


All fund risk and return metrics, ratings, and analytics were uploaded to MFO Premium on New Year’s Day, reflecting performance through December. Similar to October, we used Lipper’s Friday data drop, which was last business day of year, to get an early peek at 2022 year-end performance.


We’ve scheduled our year-in-review webinar this Friday (tomorrow), 6 January. It will highlight performance of funds across different market segments and attempt to showcase various search features, including additions since our mid-year webinar.

 
Continue reading “2022 Year-End Review Webinar”

Worst Year Ever

All fund risk and return metrics, ratings, and analytics were uploaded to MFO Premium today, 31 October, Halloween 2022. We used Lipper’s Friday data drop to get an early peek … and today markets seemed tame enough, so numbers should be pretty close to month’s end.


October was a decent one for equity funds, especially value. The Dow was up an extraordinary 14%. But still not enough to get back above water. Well, unless you consider Berkshire Hathaway (BRKA) a mutual fund, which many savvy investors do … it’s up 4-5% year-to-date (YTD). The Dow: -8%.


Continue reading “Worst Year Ever”

Happy Preferencing!

All fund risk and return metrics, ratings, and analytics were uploaded to MFO Premium Sunday, 31 July, reflecting performance through July 2022.


When we run the monthly update that close to the last business day, we will normally re-run the ratings the following Saturday to pick up any late reporting funds. This past month that version was uploaded Sunday, 7 August. We also uploaded Tuesday, 30 August using the Refinitiv datafile of 26 August.


Going forward, thanks to a suggestion by long-time subscriber Alfred, we will try to update the site database weekly. Those intramonth updates help when funds report portfolio changes, launches, and closures, etc. The datafile date will be posted on our homepage under the “What’s new?” section, each time we update the ratings. Consistent with that date, you will now find the “Month To Date [MTD]” return and rating under Calendar Month metrics in the MultiSearch results table.


Continue reading “Happy Preferencing!”